Turn your operational data into a competitive advantage.
Most EHRs generate reports. Sherpa Care delivers intelligence. Role-based dashboards unify clinical, operational, and financial metrics — from claims to care gaps to survey readiness — so every leader in your organization sees what they need to act, not just what happened.
Every leader sees what they need — not everything at once.
Dashboards are configured by role — clinical managers see care gap and outcome data, financial leaders see claims and denial trends, operations teams see scheduling efficiency and territory coverage. The right data for the right decision-maker, without digging through reports that weren't built for them.
- Clinical, financial, and operational dashboards by role
- Real-time patient insights across all care environments
- Configurable access — show each user what's relevant to them
- Drill-down from summary metrics to individual patient level
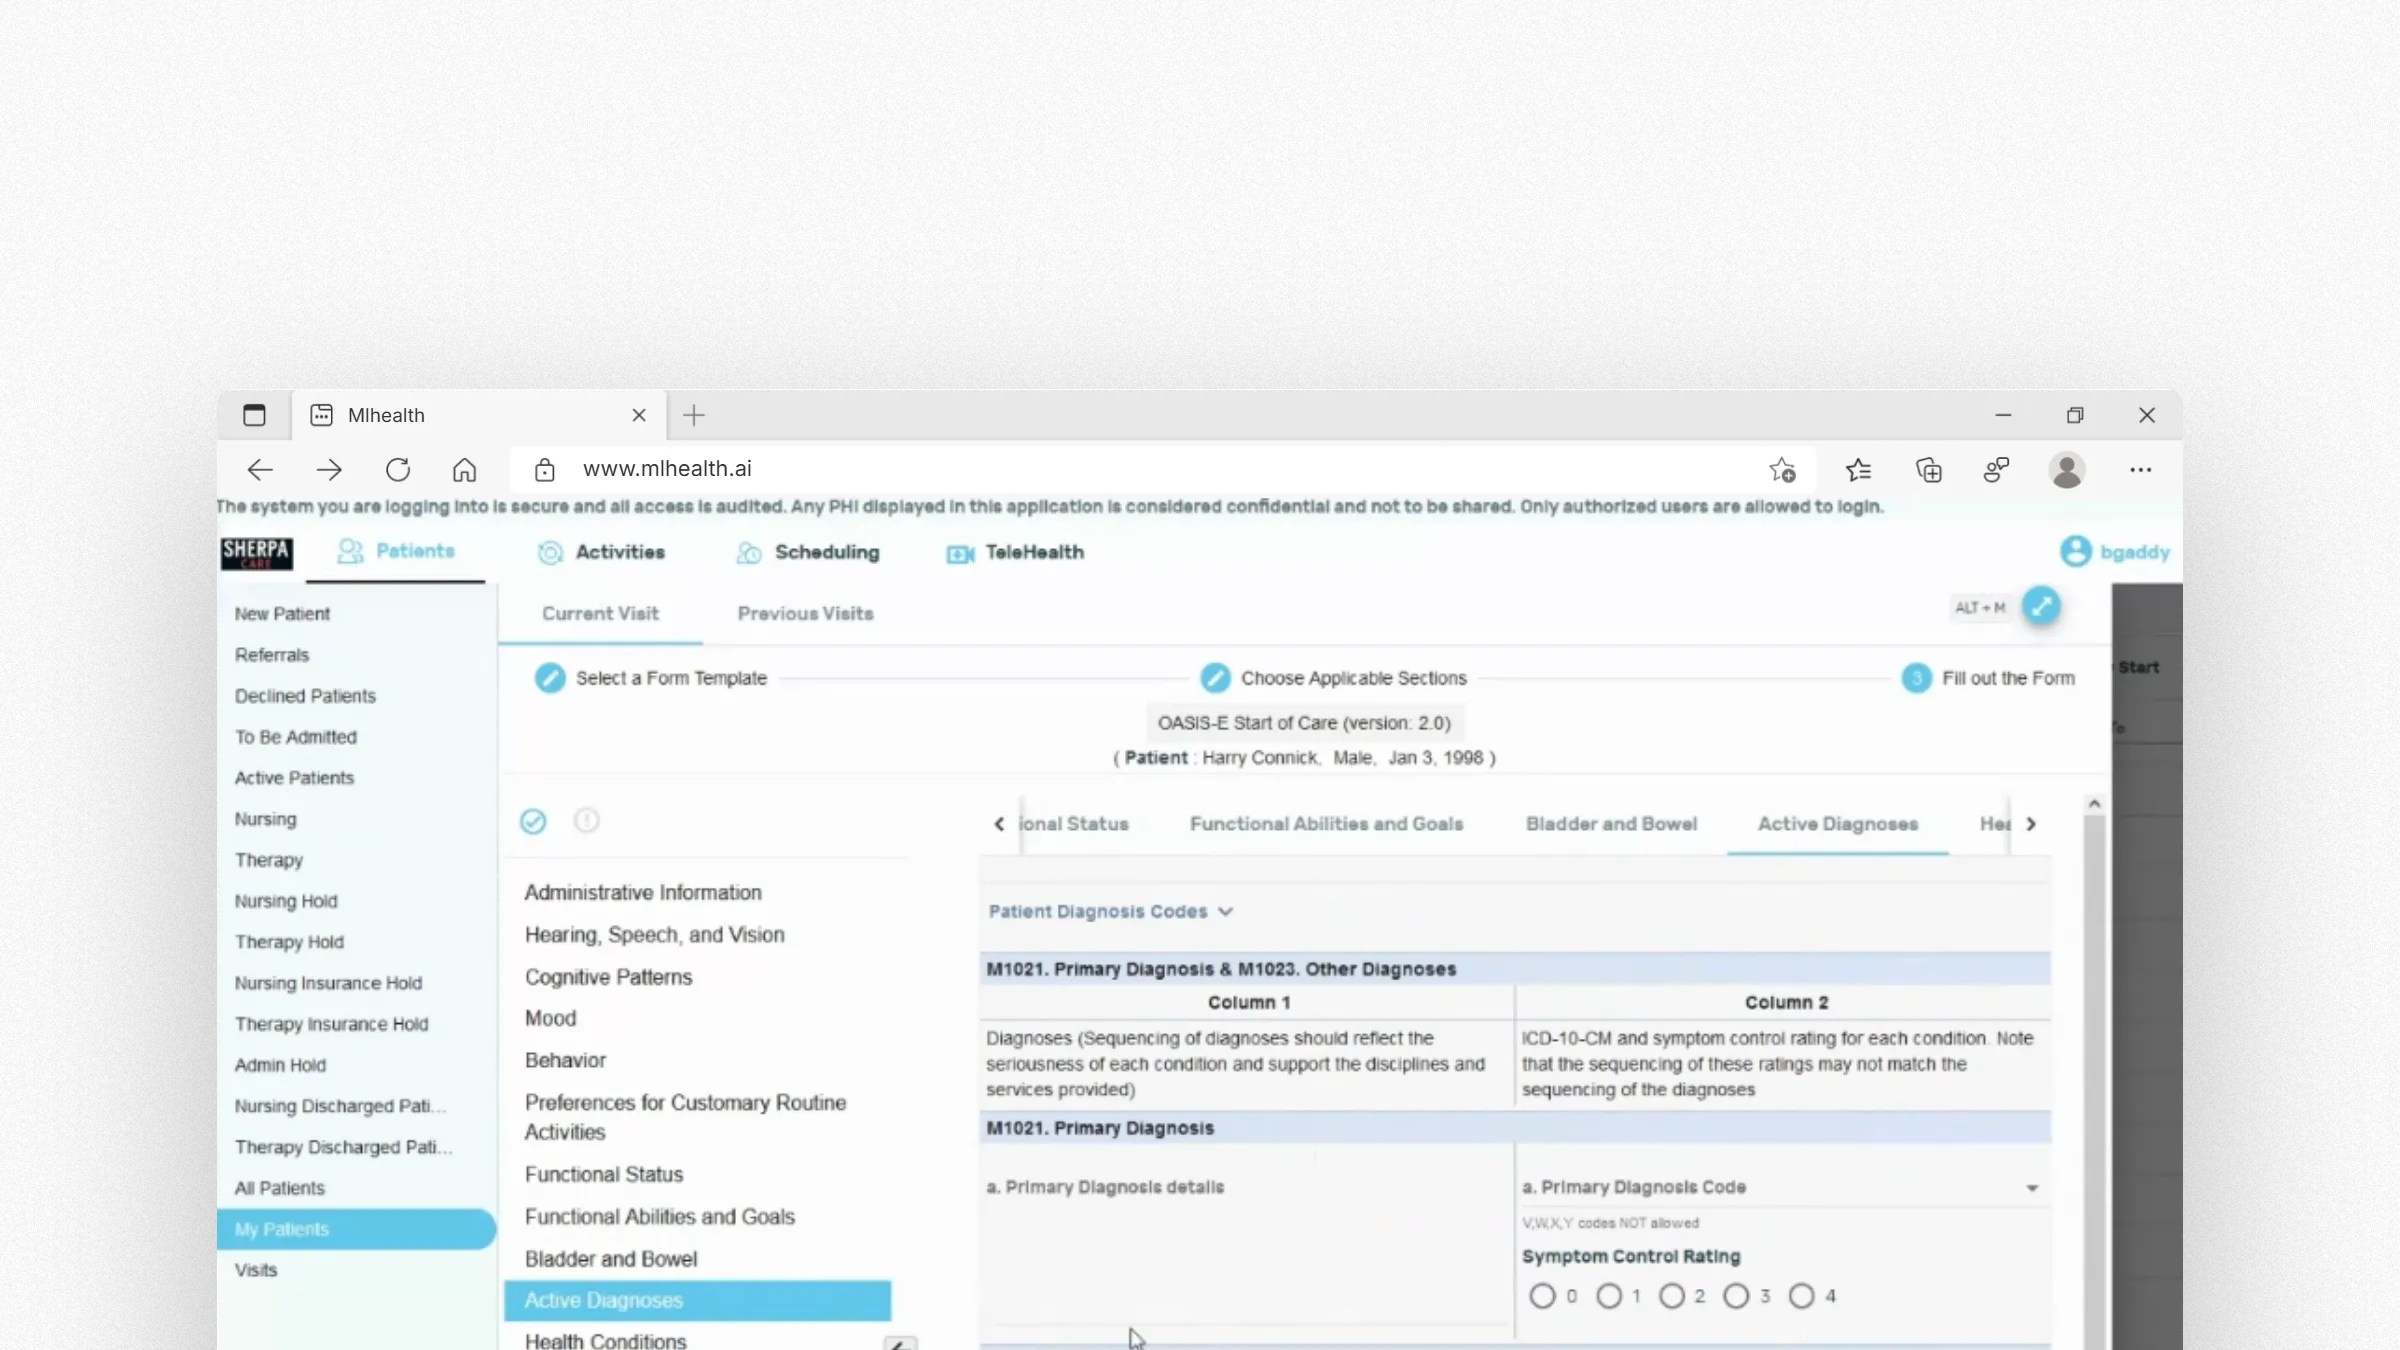
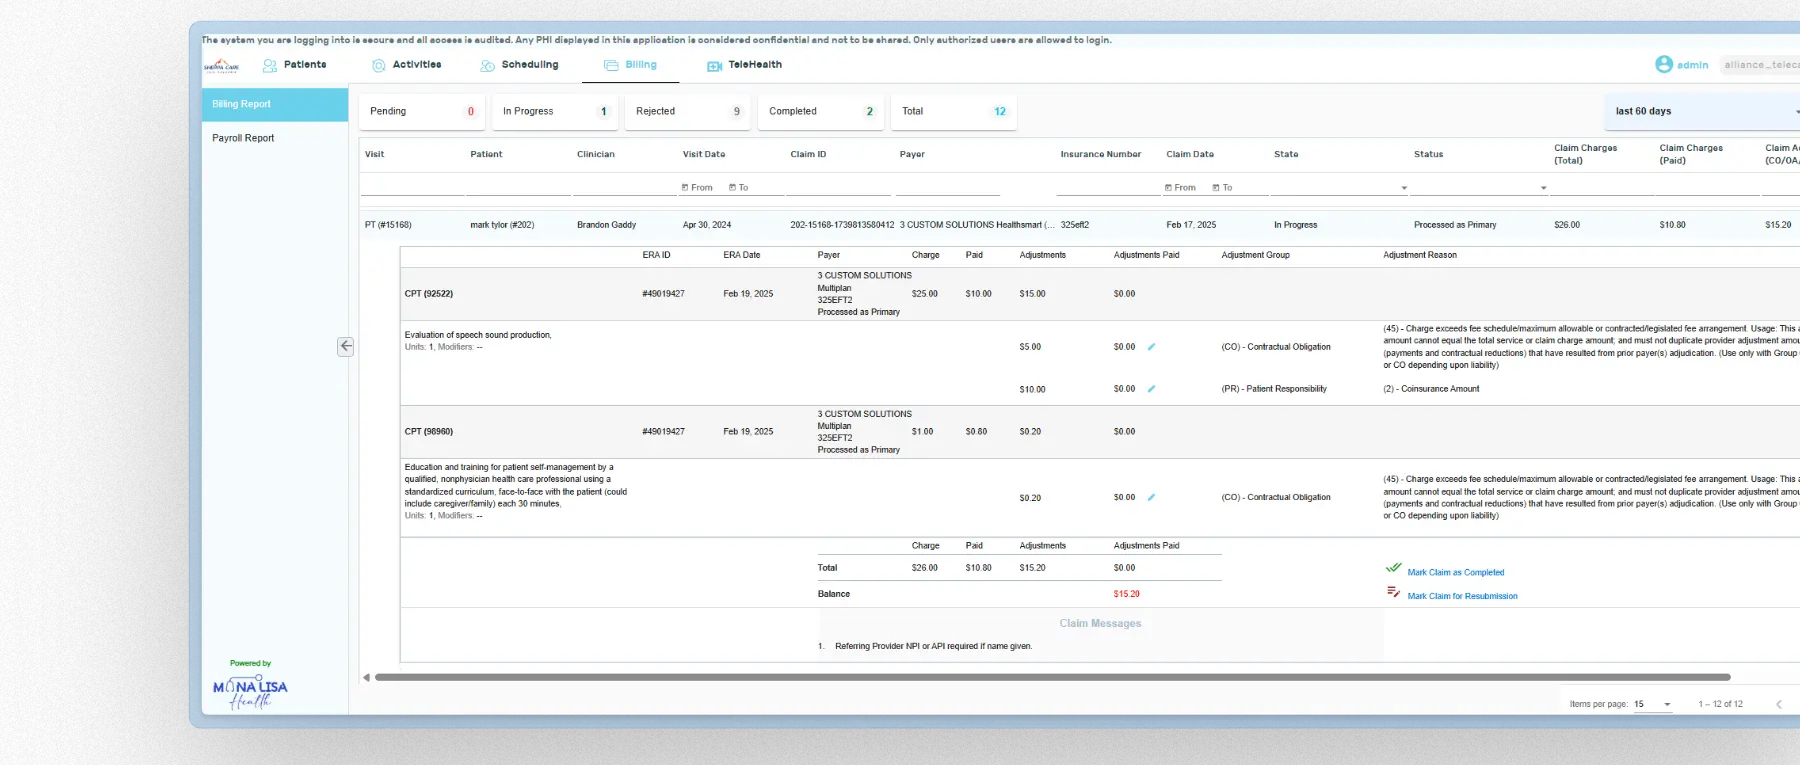
See your revenue cycle clearly.
Track claim submission rates, denial trends, reimbursement timelines, and revenue by payer — in one place. Identify which payers are slow, which codes are generating denials, and where billing gaps exist before they compound. Transform complex financial data into clear operational decisions.
- Claims status and denial rate by payer and discipline
- Reimbursement timeline tracking
- Revenue trend analysis by service line
- Early warning indicators for revenue cycle health

Optimize scheduling, territory, and staff performance.
Real-time calculation of clinician-to-patient travel distances using AI-powered proximity data — identifying inefficiencies, missed visit opportunities, and territory coverage gaps. Scheduling analytics surface patterns that inform better staffing decisions, not just react to today's crisis.
- AI-powered proximity and territory analytics
- Clinician utilization and visit volume tracking
- Scheduling efficiency and gap identification
- Staff performance metrics by discipline
Every detail, handled.
The features that make documentation not just faster, but actually complete.
Survey & Compliance Readiness
Track OASIS completion rates, documentation compliance, and certification status in real time — so survey readiness is a continuous state, not a pre-survey scramble.
Care Gap Identification
Identify patients who are behind on scheduled visits, overdue for assessments, or at risk for readmission — before the gap becomes a clinical event or a regulatory finding.
Custom Report Builder
Build reports tailored to your organization's specific metrics, payer requirements, or board reporting needs — without relying on a vendor to build each one.
Outcome Tracking
Track patient outcomes by diagnosis, clinician, team, and program — so quality improvement initiatives are grounded in actual data, not anecdote.
Benchmark Comparisons
Compare your performance against industry benchmarks for denial rates, documentation compliance, and visit completion — so you know exactly where you stand in the market.
Export & Reporting
Export any dashboard or report to PDF, CSV, or direct integration with your BI tool — Sherpa Care's data doesn't stay in a silo if you need it elsewhere.
Ready to see it in your workflow?
A 15-minute demo is enough to understand what changes. No slides — your use case, your questions, your workflow.